City Budget Forecast Summary
Table B-6 City Budget Forecast Summary
This is Table B-6 as it appears in the PCFA. The PCFA assumes the transition year is FY 2026. Estimates are provided for the transition year and the following 5 years. You should disregard any surplus or shortfall in the transition year as we don’t know when during the year that transition will occur, so the forecast for the transition year is not accurate.
You’ll notice that most of the revenue items increase year over year while most of the expenses remain the same. Finance, city attorney, and police are the most glaring errors. It is not reasonable to expect that those expenses will remain constant over five years. If you assume that revenue will increase, but expenses remain the same, cityhood seems feasible. This is a false assumption.
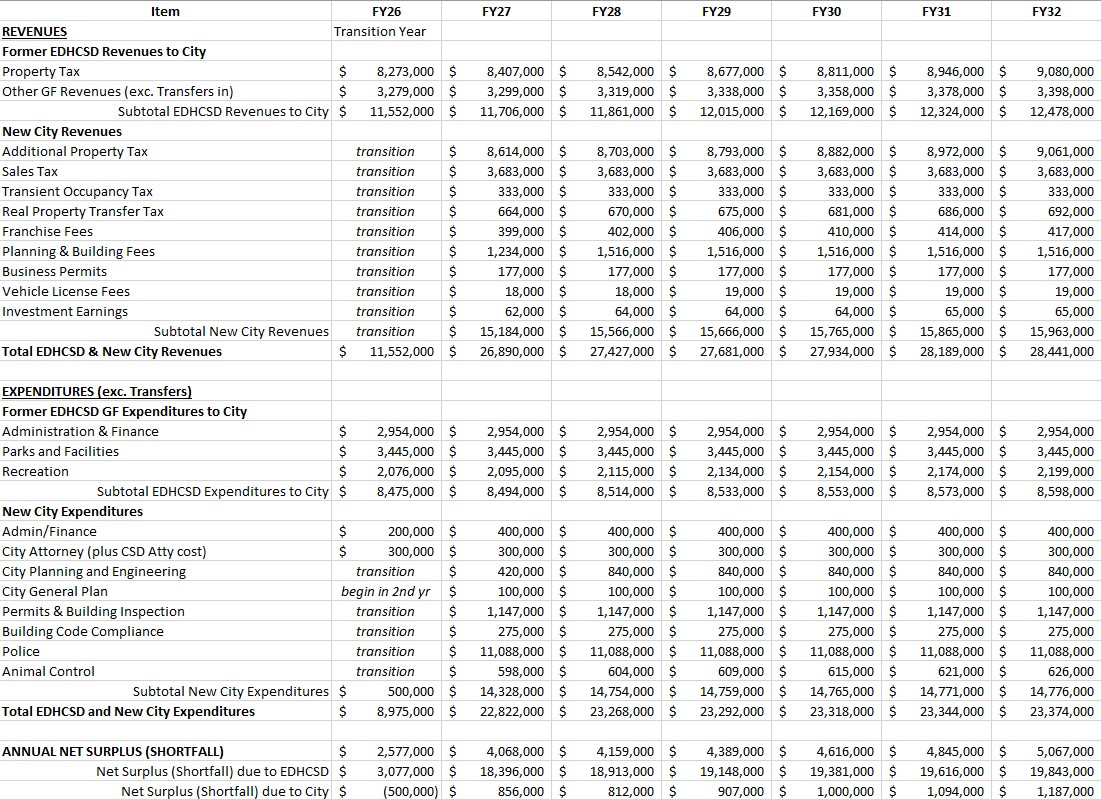
Table B-6 City Budget Forecast Summary Inflation Adjusted
This is Table B-6 adjusted for inflation for line items where inflation was not applied. To be fair, revenue was inflation adjusted for those items where inflation increases were not applied in the original forecast. Other revenue forecast amounts were assumed to be reasonable based on the PCFA analysis.
Unless forecast amounts included out-year adjustments, an inflation rate of 3.8% was applied. 3.8% is an average inflation rate from January 2020 through March 2025 as reported by the U.S. Bureau of Labor Statistics. Adjusted columns are shown in yellow. The PFCA estimated expense increases for Recreation and Animal Control across the five year period. The table used the PCFA estimated amounts, not inflation. Those items are highlighted in green. The PFCA assumed a constant $100,000 annual expense for city planning. That was left unchanged
Note that while the budget surplus remains posifive, the surplus is declining over time. Eventually, additional revenue will be requried.
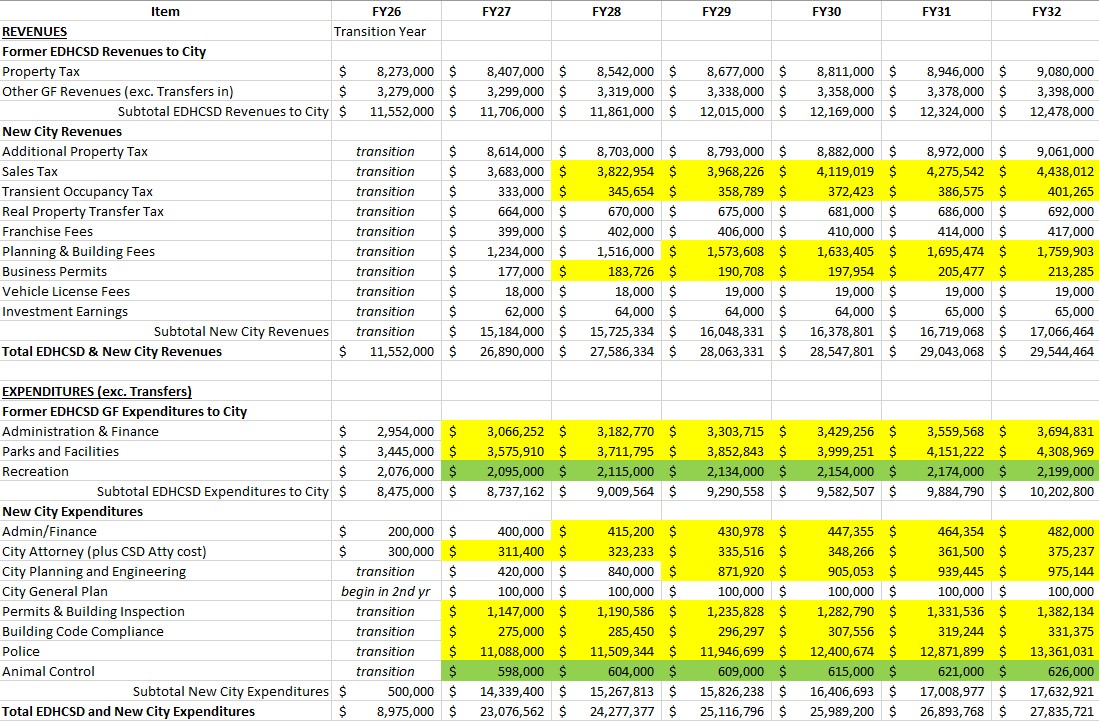
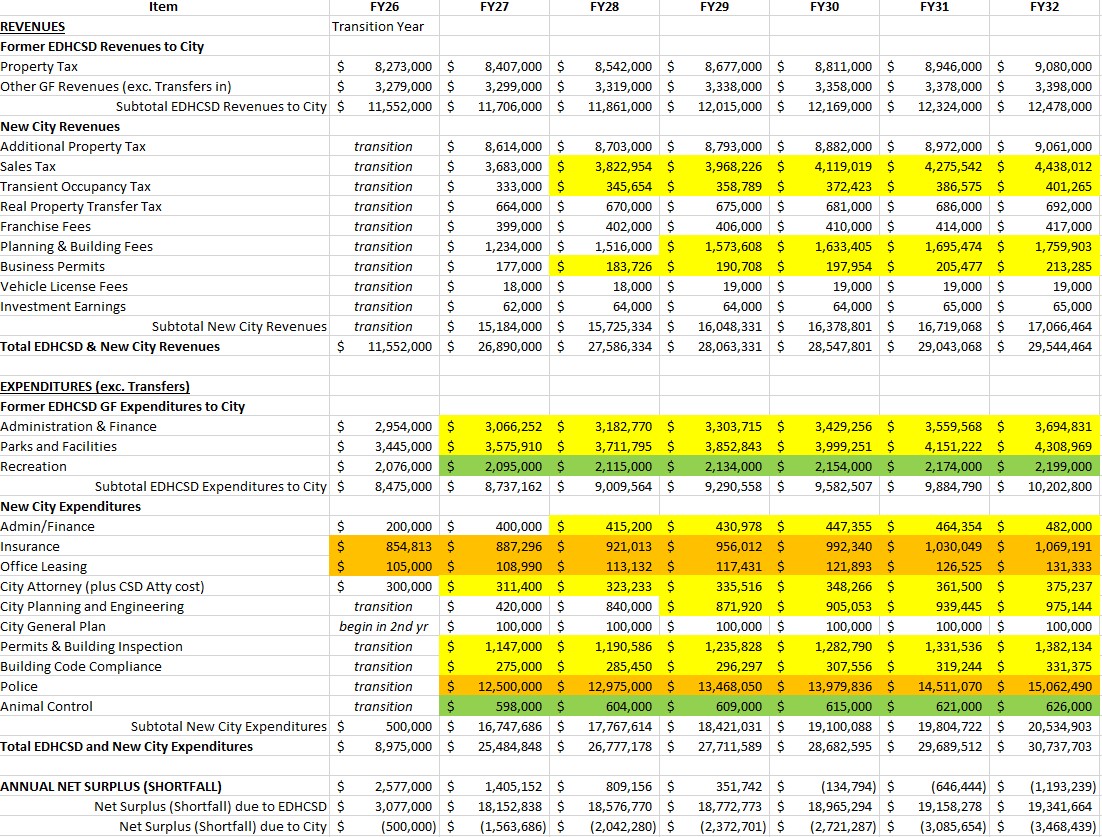
Table B-6 City Budget Forecast Summary Corrected and Inflation Adjusted
As mentioned in the PCFA analysis, the PCFA contains some important omissions. The PCFA did not include costs for building a City Hall or leasing office space for the new city employees. There was no accounting for casualty or liability insurance. The costs for police services was underestimated. The PCFA admitted that their per capita estmate for El Dorado Hills was less than a similar cost for Folsom1, but offered no explanation as to why the lower cost was used in the budget forecast. We’ll go into greater detail on police services on the city services page.
The following table adds the missing items, highlighted in orange, and applies the 3.8% inflation rate over the five year estimation period. The insurance cost of $854,813 was obtained from the PCFA comparison of expenses for the city of Lincoln, as adjusted for the popluation difference in El Dorado Hills.2 Office leasing was based on an estimate for a 5,000 sq. ft. office at $21 per sq. ft. per year.3. A resonable cost for Police services was adjusted to $12,500,000. See the City Services page for a discussion of police service costs.
Now we see that the revenue surplus disappears in FY29 and unless more revenue is added, the city will operate at a loss in FY30 and beyond.
Try it yourself
Click the spreadsheet icon below to download a copy of the spreadsheet used for this analysis. Adjust the spreadsheet as desired to run your own “What If” analysis of city revenues and expenses.
The inflation rate can be changed in cell K-1. Inflation will be applied to all cells highlighted in yellow. If you are changing a “Year 1” cost, you should make the change in the unhighlighted cell immediately to the left of yellow cells before inflation begins to be applied. Note that the PFCA included some assumptions where costs would double from year 1 to year 2. City Admin/Finance and City Planning are examples of this cost doubling. You should refer to the PCFA before changing their underlying assumptions.